Part 1: Protein Structure - The Ramachandran Plot
AIM: To understand the Ramachandran Plot, what it tells us and why it is useful.
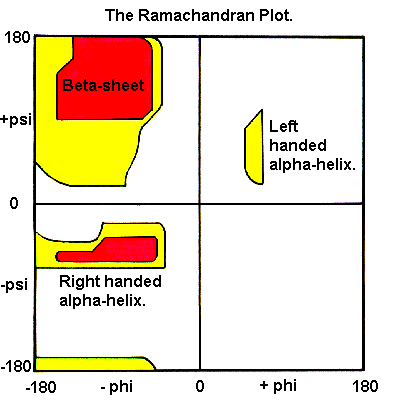
Ramachandran and Ramakrishnan plotted backbone psi angles against phi angles to generate the 'Ramachandran Plot'

- The shaded regions show combinations of phi/psi angles which are energetically favoured and therefore frequently observed.
- Disallowed regions result from steric hindrance
- The most favoured areas of the plot correspond to the common secondary structures (alpha helices and beta strands)
Download the following PDB files:
Open our simple Ramachandran plot server.
- Click the 'Browse...' button on the Ramachandran server and locate the first of the PDB files that you downloaded. Click Submit. Observe the distribution of the blue and green spots on the plot which represent the phi/psi combinations of the amino acids in your protein.
- Repeat with each of the PDB files that you downloaded - you might want to open additional tabs or windows so you can compare the results.
Note that the 'allowed' areas as shown in the picture above, and in this server, are not particularly accurate, so don't be surprised if you see phi/psi angle combinations outside these areas.
You can also visit the PDBSum web server at the EBI which has pre-calculated Ramachandran plots - simply enter the PDB codes for the four proteins of interest, or go to the links directly:
- 1HBS - an all-alpha protein, 3.00A resolution
- 2IG2 - an all-beta protein, 3.00A resolution
- 2PEG - an all-alpha protein, 1.48A resolution
- 3B7V - an all-beta protein, 1.46A resolution
(Simply clicking each of these will open a new tab for each)
First note the similarities and differences between the all-alpha and all-beta proteins.
Considering the low resolution (3.00A) structures, you should observe that the distribution of spots on the all-alpha and all-beta proteins is surprisingly similar. Both have the majority of spots falling within the so-called 'alpha' and 'beta' regions of the plot. Why do you think this is?
Considering all four plots, comparing the all-alpha and all-beta proteins with one another and comparing the low and high resolution structures with one another, why do you think the Ramachandran plot is useful?