Introduction
Why Model?
Knowledge of the 3D structure of a protein is of great assistance in planning experiments on understanding protein function and during drug design.
The 3D structure of a protein can be determined using techniques such as X-ray crystallography and Nuclear Magnetic Resonance (NMR). However, these techniques need very pure protein to be produced in quite large quantities and at high concentration. In the case of X-ray crystallography, this must be sufficient for the protein to be crystallized. The process is difficult and time consuming. Data collection requires large, complex and expensive equipment and data processing and analysis can be time consuming.
The experimental structures of proteins vary in quality. In general, structures solved by NMR are not as of high quality as those solved by X-ray crystallography (though they give more information about dynamics). Depending on how well the protein forms a crystal, the quality of the structure obtained (known as the 'resolution') will vary. Low resolution structures may contain errors.
On this page, there are a number of links to external pages (particularly on Wikipedia). These are there for completeness and background reading. You are not expected to view them during the practical.
Wikipedia gives a good introduction to these techniques:
- https://en.wikipedia.org/wiki/X-ray_crystallography
- https://en.wikipedia.org/wiki/Nuclear_magnetic_resonance
In contrast, sequencing DNA or RNA (from which protein sequences can be derived) is fast and cheap.
The Protein Databank (PDB, http://www.rcsb.org) stores the structures of proteins that have been solved using experimental techniques such as X-ray crystallography and NMR. While 25 structures are being deposited with the PDB every day, the number of available protein sequences greatly outstrips the number of structures. Consequently protein modelling is necessary to overcome the expense, complexity and time constraints of experimental techniques.
The PDB format is a standard format used for storing the atomic coordinates of protein (and DNA) structures. Consequently we refer to files in this format as PDB files even if they are models that you have created rather than being files downloaded from the Protein Databank.
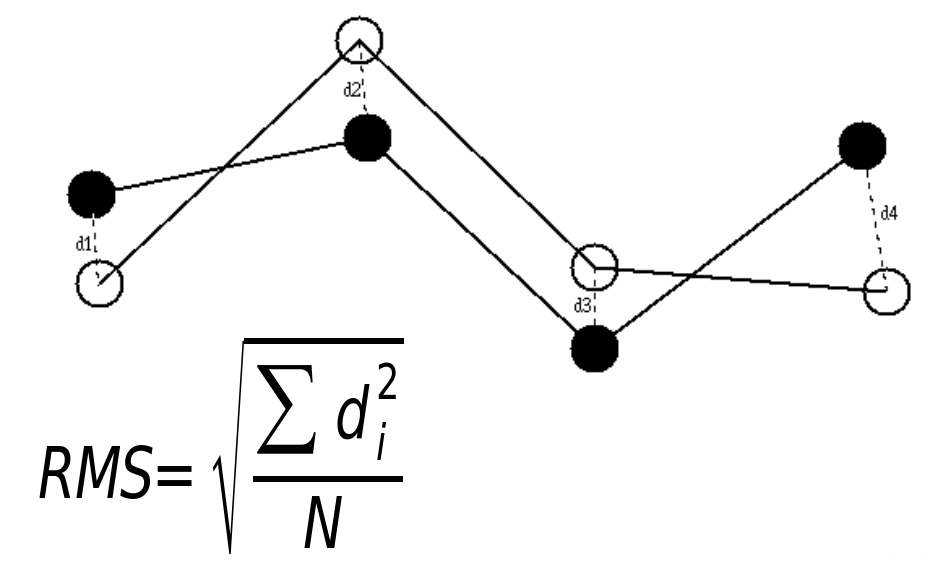
The accuracy of a model cannot be determined until we have an experimental structure of the protein. When we do have a structure, the accuracy can be determined using a parameter known as the Root Mean Square Deviation (RMSD). For each atom, we measure the square of the distance between this atom in the model and the known structure (the 'square deviation'). We calculate the mean of these values (the 'mean square deviation') and then take the square root of the result (the 'root mean square deviation'). See Figure 1.
A minimization method (https://en.wikipedia.org/wiki/Gradient_descent) is used to optimize the fit between the two structures - the two structures are overlapped such that their centre of geometry is in the same place and one of the structures is rotated to minimize the RMSD.
We can calculate an RMSD over all atoms in a protein, or just the backbone atoms (ignoring the sidechains), or just the Cα atoms. Generally we are aiming for a Cα-RMSD ≤ 2.0Å for a high quality, useful, model.
Obtaining a high quality model depends on:
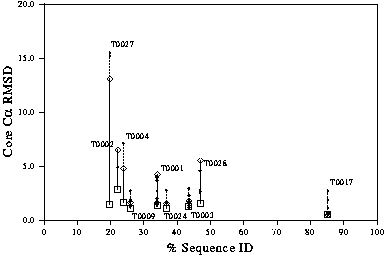
- The sequence identity of the chosen template structure(s) (see Figure 2)
- The number of insertion/deletion ("indel") sites in the target/template sequence alignment and the sizes of these
- The quality of the sequence alignment
- The choice of modelling software
- The experience and skill of the modeller
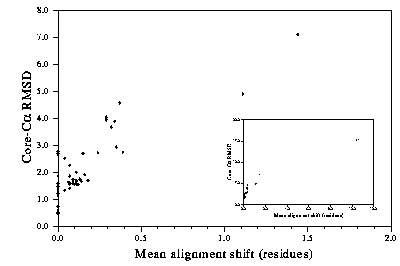
If you have a template structure with a given sequence identity, the key factor which will affect the quality of your model is the accuracy of the alignment. Automated alignment methods must be used with care. Multiple sequence alignment can be a help, even if only one of the sequences is used as a template. Figure 3 shows the relationship between accuracy of the model and the mean error in the alignment.
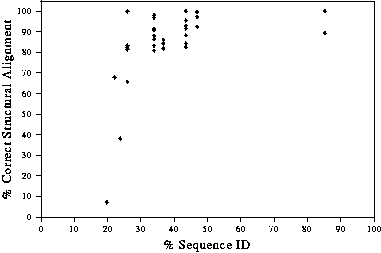
At high sequence identity (especially if there are very few indels), it is easy to get the alignment correct. As the sequence identity drops below 50%, it is more difficult to obtain the correct alignment, though, with care, still possible down to around 25% sequence identity. Below this, it is very difficult to obtain the alignment correct. Figure 4 shows the relationship between accuracy of the alignment and the percentage sequence identity.
There are three main comparative modelling methods:
- Manual methods Fragments from one or more templates are assembled using interactive molecular graphics software such as Insight, Quanta, O, Coot, or Chimera. This is generally followed by a molecular mechanics technique (energy minimisation, https://en.wikipedia.org/wiki/Molecular_mechanics) to relieve bad clashes.
- Energy methods Typified by methods such as conformational search (CONGEN) which explore all possible conformations for a segment of protein (typically only up to 10 amino acids) and MODELLER which uses molecular mechanics techniques to satisfy simultaneously normal atomic constraints (such as bond lengths and angles) and distance constraints from the template structure(s).
- Automated knowledge-based methods These are automated fragment-assembly techniques similar to the manual methods. Examples are COMPOSER and the Web-based SwissModel which you will use in this practical.
We cannot assess the actual RMSD of a model until someone solves the structure experimentally. However, given the things listed above that infuence the quality of a model and characteristics of the model itself, we can assess whether a model is likely to be accurate.
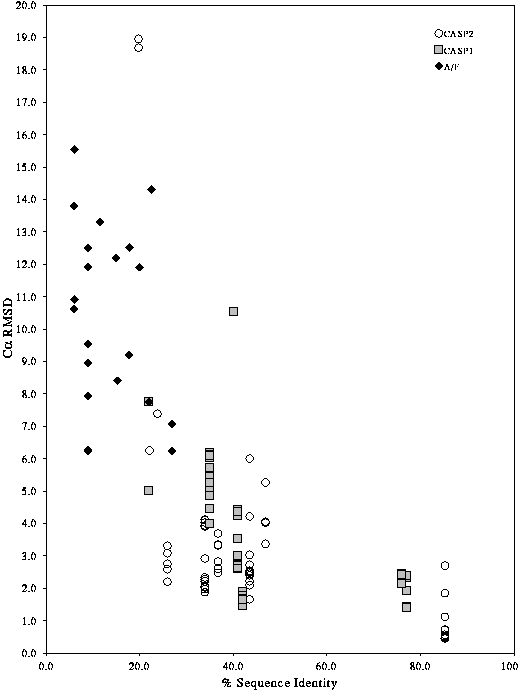
The expected level of accuracy of a model can be seen from the graph in Figure 5. This graph was calculated from the results of the blind modelling experiments CASP1 and CASP2. At around 30-40% sequence identity, the spread of model quality (as assessed by RMS deviation) is large.
At >80% sequence identity, one can obtain models which are as similar to the crystal structure as one crystal structure is to another.
At lower levels of sequence identity, how can we assess the quality of our models? The following parameter which can be measured without the knowledge of the correct structure can give some hints of quality:
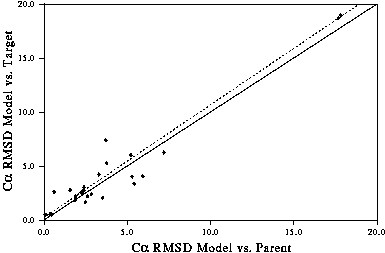
- Deviation of the model from the template. RMS deviation of the model compared with the "correct" structure is well correlated with the deviation between the model and the template structure(s). i.e. The more changes which are made to the template(s), the more likely you are to make a mistake. See Figure 6.
The structural quality of a model can be assessed using ProCheck or WhatCheck. These programs rate a model or a structure on the basis of various geometrical parameters derived from known high quality crystal structures. However, there is not a direct correlation between these quality factors and the accuracy of the model. While it is true to say that bad ProCheck parameters indicate a bad model, it is not necessarily true that good parameters indicate a good model. Any model that has gone through some sort of molecular mechanics optimization will have optimized most of these structural parameters in any case.